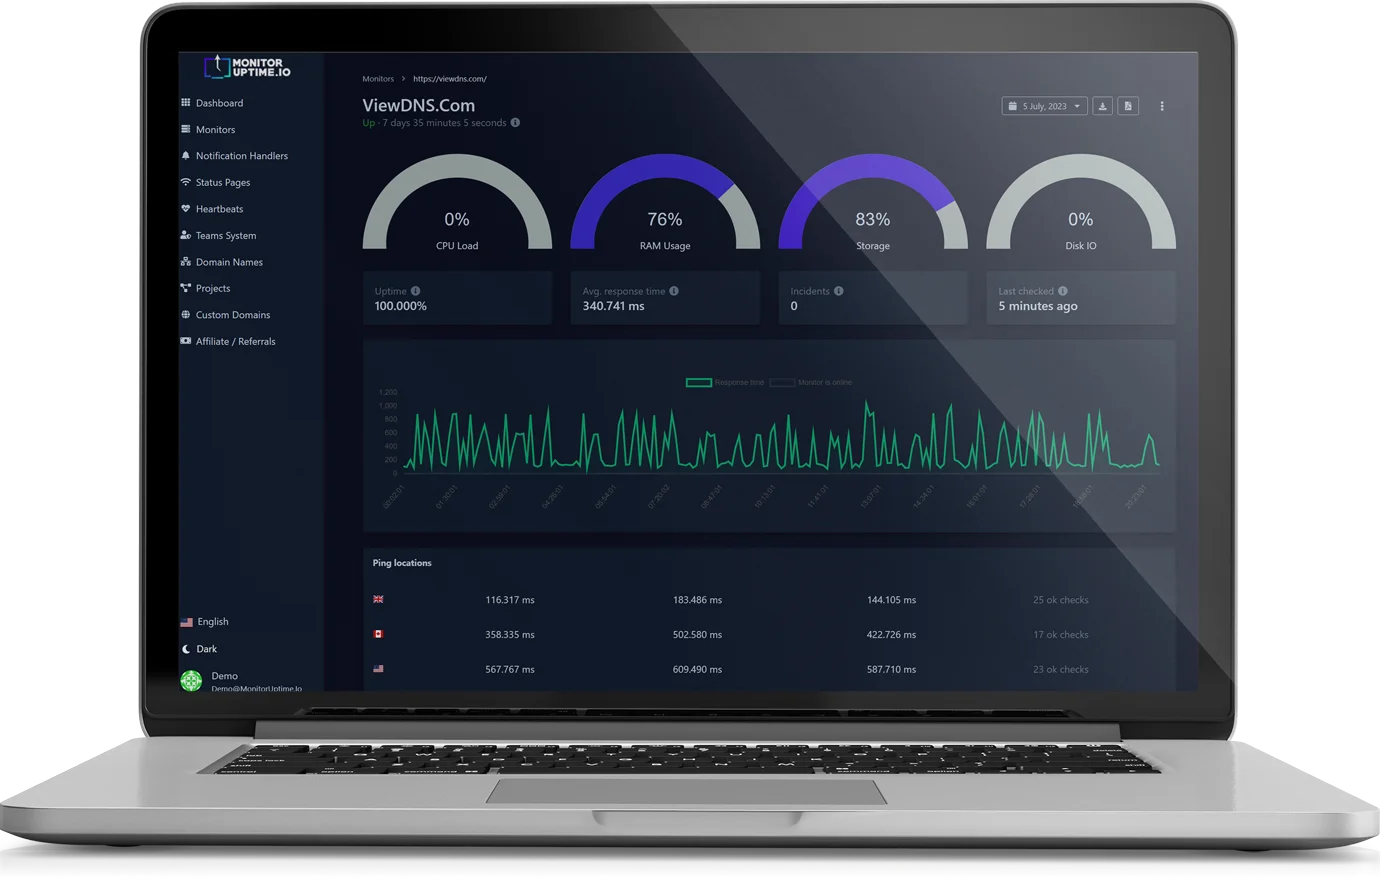
CPU, RAM, Disk Monitoring
Introducing our powerful CPU, RAM, Disk Monitoring feature. Stay ahead of server issues with real-time insights and proactive management. Learn how to create your own script to generate the required JSON format. Get started today!
New Feature Announcement: CPU, RAM, Disk Monitoring
Introducing Our Powerful Monitoring Solution
Dear Customers,
We are thrilled to announce the launch of our latest feature CPU, RAM, Disk Monitoring, a comprehensive solution designed to empower you with real-time insights into your server's performance. With this cutting-edge feature, you can effortlessly keep an eye on crucial server metrics and take proactive measures to optimize your infrastructure.
The Benefits of CPU, RAM, Disk Monitoring
Our monitoring solution revolutionizes the way you manage your servers by offering the following key benefits:
- Proactive Server Management: Identify potential issues before they escalate, such as CPU overload or disk space exhaustion. Stay ahead of the game with instant notifications and take prompt action to prevent downtime.
- Improved Troubleshooting: In the unfortunate event of a server crash, our monitoring tool provides valuable insights to help you diagnose the problem. Examine critical metrics, such as CPU utilization, memory usage, and disk occupancy, leading you closer to identifying the root cause.
- Customizable and Extensible: Our monitoring solution utilizes JSON output generated by a PHP script, allowing for flexibility and easy integration into your existing tech stack. By granting sudo or root access to the script, you gain access to comprehensive server metrics in the required format.
- Accessible Web Interface: Seamlessly access the monitoring results via a web interface accessible over HTTP or HTTPS. Conveniently review crucial server statistics from anywhere, at any time.
- Future Enhancements: We are continuously working on expanding our tech stack compatibility, ensuring that our solution meets the diverse needs of our customers. However, if you prefer to create your own script, make sure it generates results in the provided JSON format.
Creating Your Own Script
If you prefer to create your own script to generate the monitoring results in the required JSON format, follow these guidelines:
- Create a script in your preferred programming language (e.g., Python, Bash, etc.).
- Ensure that your script has the necessary permissions to access the server's metrics. You may need sudo or root access depending on your system configuration.
- The script should output the following JSON structure:
{
    "cpu_load_percent": 12.67,
    "memory_usage_percent": 24.56,
    "disk_usage_percent": 30.67,
    "num_queries": 14009540,
    "disk_io_wait_time": 0
}
Make sure the script is accessible from the web (via HTTP or HTTPS) and produces the JSON output as shown above.
Get Started Today
Experience the power of our CPU, RAM, Disk Monitoring feature by logging into your account and enabling it for your servers. Don't miss out on the opportunity to proactively manage your infrastructure and gain valuable insights that can save you time and resources.
If you have any questions or need assistance with creating your own script, please don't hesitate to contact our support team. We're here to help you get started!


